
WASHINGTON — Federal Reserve officials said Wednesday that inflation fell further toward their target level in recent months but signaled that they expect to cut their benchmark interest rate just once this year.
The policymakers' forecast for one rate cut was down from their previous projection of three cuts, because inflation, despite having cooled in the past two months, remains persistently above their target level.
The scaled-back estimate for rate cuts came as something of a surprise, given that the government reported earlier Wednesday that consumer inflation eased in May more than most economists had expected. That report suggested that the Fed's high-rate polices are succeeding in taming inflation.

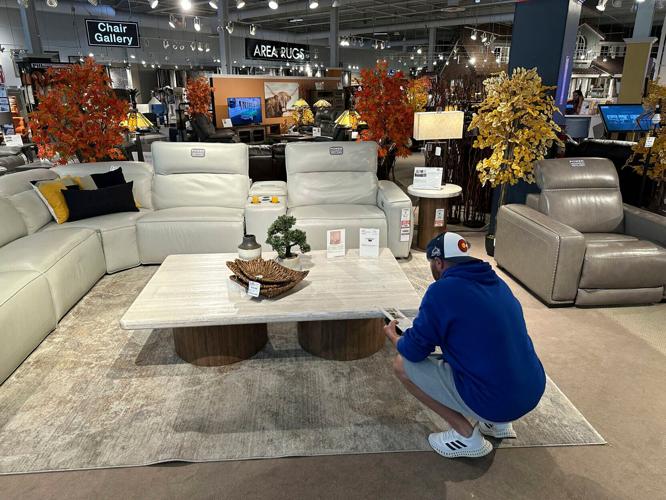
A shopper pauses Sunday at a display in a furniture store in Englewood, Colo.
Consumer prices excluding volatile food and energy costs — the closely watched “core” index — rose just 0.2% from April, the smallest rise since October. Measured from a year earlier, core prices climbed 3.4%, the mildest pace in three years.
People are also reading…
Whenever the Fed begins to reduce its benchmark rate, now at a 23-year high, it would eventually lighten loan costs for consumers, who face punishingly high rates for mortgages, auto loans, credit cards and other forms of borrowing.
The central bank's rate policies over the next several months could also have consequences for the presidential race.
Though the unemployment rate is a low 4%, hiring is robust and consumers continue to spend, voters have taken a generally sour view of the economy under President Joe Biden. In large part, that's because prices remain much higher than they were before the pandemic struck.

Federal Reserve Board Chair Jerome Powell speaks Wednesday during a news conference at the Federal Reserve in Washington.
Speaking at a news conference after the Fed meeting ended, Chair Jerome Powell seemed to downplay the significance of the policymakers' collective forecast of just one rate cut in 2024. That forecast is derived from the individual predictions of 19 policymakers, and Powell noted that 15 of the officials projected one or two rate cuts this year.
"I would look at all of them as plausible," he said.
Some economists say two rate cuts, with the first one coming as early as September, are still possible despite the central bank's prediction of just one.
"I don't think September's off the table," said Matthew Luzzetti, chief U.S. economist at Deutsche Bank. "To get there, you'd have to have a string of inflation reports like the one we got this morning."
In its policy statement, the Fed noted that the economy is growing steadily, while hiring has "remained strong." Fed officials also noted that in recent months there has been "modest" further progress toward their 2% inflation target.
That is a more positive assessment than after the Fed's previous meeting May 1, when the officials noted a lack of progress.
Still, the central bank made clear that further improvement is needed.
"We'll need to see more good data to bolster our confidence that inflation is moving sustainably toward 2%," Chair Jerome Powell said at a news conference after the Fed meeting ended.

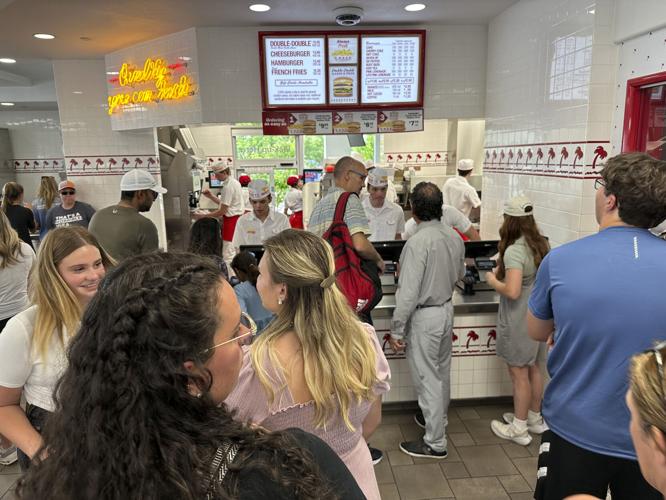
Customers line up Sunday to order at an In-N-Out in Lone Tree, Colo.
The policymakers, as expected, kept their key rate unchanged at about 5.3%. The benchmark rate has remained at that level since July of last year, after the Fed raised it 11 times to try to slow borrowing and spending in a bid to cool inflation.
The Fed's latest projections are by no means fixed in time. The policymakers frequently revise their plans for rate cuts — or hikes — depending on how economic growth and inflation evolve over time.
Inflation tumbled from a peak of 9.1% two years ago. The policymakers now face the delicate task of keeping rates high enough to slow spending and fully defeat high inflation without derailing the economy.
Measures of inflation cooled steadily in the second half of last year, raising hopes that the Fed could achieve a rare "soft landing," conquering inflation through rate hikes without causing a recession. Inflation came in unexpectedly high in the first three months of this year, delaying hoped-for Fed rate cuts.
Asked at his news conference about the eventual need for rate cuts, Powell said, "We think ultimately if you set (interest rate) policy at the restrictive level, eventually you will see real weakening in the economy."

A screen displays a May 1 news conference with Federal Reserve Chairman Jerome Powell on the floor at the New York Stock Exchange in New York.
Though the economy managed to keep growing despite the high rates the central bank has engineered, the Fed chair said that "ultimately, we think rates will have to come down to continue to support that. So far, they haven't had to."
As part of the updated quarterly forecasts the policymakers issued Wednesday, they projected that the economy will grow 2.1% this year and 2% in 2025, the same as they envisioned in March.
They expect core inflation to be 2.8% by year's end, according to their preferred gauge, up from a previous forecast of 2.6%. And they project that unemployment will stay at its current 4% rate by the end of this year and edge up to 4.2% by the end of 2025.
The expectation that the unemployment rate will remain around those low levels indicates that the officials believe that while the job market will gradually slow, it will remain fundamentally healthy.
"By so many measures," Powell said, "the labor market was kind of overheated two years ago, and we've seen it move back into much better balance between supply and demand."
Metros where homes are selling for the most over asking price
#46. Anaheim, California

- Average price difference: 0.02% over asking
-- Median list price: $1,222,450
-- Median sale price: $1,170,000
- Total homes sold: 1,885
-- Share that sold above list: 42.5%
#45. Baltimore, Maryland

- Average price difference: 0.07% over asking
-- Median list price: $380,000
-- Median sale price: $389,000
- Total homes sold: 3,003
-- Share that sold above list: 42.4%
#44. Bremerton, Washington

- Average price difference: 0.08% over asking
-- Median list price: $559,450
-- Median sale price: $575,000
- Total homes sold: 394
-- Share that sold above list: 33.5%
#43. Washington DC

- Average price difference: 0.12% over asking
-- Median list price: $542,990
-- Median sale price: $565,000
- Total homes sold: 4,885
-- Share that sold above list: 38.3%
#42. Seattle, Washington

- Average price difference: 0.15% over asking
-- Median list price: $829,000
-- Median sale price: $826,000
- Total homes sold: 3,166
-- Share that sold above list: 32.2%
You may also like: Best and worst metro areas for first-time homebuyers in 2024
#41. Harrisburg, Pennsylvania

- Average price difference: 0.23% over asking
-- Median list price: $279,990
-- Median sale price: $295,500
- Total homes sold: 675
-- Share that sold above list: 39.6%
#40. Lake County, Illinois

- Average price difference: 0.25% over asking
-- Median list price: $335,000
-- Median sale price: $369,000
- Total homes sold: 976
-- Share that sold above list: 45.4%
#39. Elgin, Illinois

- Average price difference: 0.26% over asking
-- Median list price: $349,900
-- Median sale price: $355,000
- Total homes sold: 919
-- Share that sold above list: 43.1%
#38. St. Louis, Missouri

- Average price difference: 0.3% over asking
-- Median list price: $264,900
-- Median sale price: $269,900
- Total homes sold: 3,391
-- Share that sold above list: 42.7%
#37. Los Angeles, California

- Average price difference: 0.39% over asking
-- Median list price: $900,000
-- Median sale price: $900,000
- Total homes sold: 4,576
-- Share that sold above list: 46.2%
You may also like: The 50 places where homes are selling the fastest
#36. Madison, Wisconsin

- Average price difference: 0.43% over asking
-- Median list price: $413,450
-- Median sale price: $425,000
- Total homes sold: 799
-- Share that sold above list: 41.6%
#35. Lansing, Michigan

- Average price difference: 0.44% over asking
-- Median list price: $194,900
-- Median sale price: $222,000
- Total homes sold: 564
-- Share that sold above list: 45.4%
#34. Grand Rapids, Michigan

- Average price difference: 0.51% over asking
-- Median list price: $340,000
-- Median sale price: $339,000
- Total homes sold: 1,166
-- Share that sold above list: 39.7%
#33. Rockingham County, New Hampshire

- Average price difference: 0.6% over asking
-- Median list price: $585,000
-- Median sale price: $568,450
- Total homes sold: 589
-- Share that sold above list: 49.4%
#32. New York, New York

- Average price difference: 0.72% over asking
-- Median list price: $749,999
-- Median sale price: $750,000
- Total homes sold: 5,460
-- Share that sold above list: 36.4%
You may also like: Which counties have the most prewar homes? Compare historic homes in every state
#31. Reading, Pennsylvania

- Average price difference: 0.8% over asking
-- Median list price: $279,950
-- Median sale price: $285,250
- Total homes sold: 440
-- Share that sold above list: 43%
#30. Poughkeepsie, New York

- Average price difference: 0.83% over asking
-- Median list price: $439,900
-- Median sale price: $460,000
- Total homes sold: 632
-- Share that sold above list: 49.8%
#29. Frederick, Maryland

- Average price difference: 0.85% over asking
-- Median list price: $545,900
-- Median sale price: $575,500
- Total homes sold: 1,251
-- Share that sold above list: 46.1%
#28. Richmond, Virginia

- Average price difference: 0.92% over asking
-- Median list price: $395,000
-- Median sale price: $388,935
- Total homes sold: 1,466
-- Share that sold above list: 42.8%
#27. Allentown, Pennsylvania

- Average price difference: 1.04% over asking
-- Median list price: $349,900
-- Median sale price: $340,000
- Total homes sold: 830
-- Share that sold above list: 48.2%
You may also like: When seniors move homes, how far do they go?
#26. Portland, Maine

- Average price difference: 1.04% over asking
-- Median list price: $519,000
-- Median sale price: $550,000
- Total homes sold: 763
-- Share that sold above list: 45%
#25. Green Bay, Wisconsin

- Average price difference: 1.18% over asking
-- Median list price: $330,000
-- Median sale price: $319,000
- Total homes sold: 332
-- Share that sold above list: 49.7%
#24. Montgomery County, Pennsylvania

- Average price difference: 1.23% over asking
-- Median list price: $469,990
-- Median sale price: $500,000
- Total homes sold: 2,129
-- Share that sold above list: 46.4%
#23. Milwaukee, Wisconsin

- Average price difference: 1.23% over asking
-- Median list price: $329,900
-- Median sale price: $345,500
- Total homes sold: 1,665
-- Share that sold above list: 53.8%
#22. Providence, Rhode Island

- Average price difference: 1.26% over asking
-- Median list price: $499,900
-- Median sale price: $496,500
- Total homes sold: 1,490
-- Share that sold above list: 54.7%
You may also like: The richest town in every state
#21. Nassau County, New York

- Average price difference: 1.55% over asking
-- Median list price: $699,999
-- Median sale price: $715,000
- Total homes sold: 2,416
-- Share that sold above list: 56.5%
#20. Boston, Massachusetts

- Average price difference: 1.61% over asking
-- Median list price: $689,900
-- Median sale price: $730,000
- Total homes sold: 3,845
-- Share that sold above list: 51.8%
#19. Lancaster, Pennsylvania

- Average price difference: 1.72% over asking
-- Median list price: $325,000
-- Median sale price: $337,450
- Total homes sold: 477
-- Share that sold above list: 44.9%
#18. Worcester, Massachusetts

- Average price difference: 1.86% over asking
-- Median list price: $450,000
-- Median sale price: $462,000
- Total homes sold: 953
-- Share that sold above list: 59.4%
#17. Norwich, Connecticut

- Average price difference: 1.98% over asking
-- Median list price: $375,125
-- Median sale price: $394,000
- Total homes sold: 308
-- Share that sold above list: 56.2%
You may also like: Average home sale price in the U.S. nears $1 million in higher-priced housing markets
#16. New Brunswick, New Jersey

- Average price difference: 2.01% over asking
-- Median list price: $569,000
-- Median sale price: $560,000
- Total homes sold: 2,700
-- Share that sold above list: 54.4%
#15. Camden, New Jersey

- Average price difference: 2.18% over asking
-- Median list price: $349,990
-- Median sale price: $365,000
- Total homes sold: 1,420
-- Share that sold above list: 57.7%
#14. Springfield, Massachusetts

- Average price difference: 2.37% over asking
-- Median list price: $347,250
-- Median sale price: $365,000
- Total homes sold: 611
-- Share that sold above list: 60.1%
#13. Albany, New York

- Average price difference: 2.43% over asking
-- Median list price: $320,000
-- Median sale price: $330,000
- Total homes sold: 906
-- Share that sold above list: 57.5%
#12. New Haven, Connecticut

- Average price difference: 2.52% over asking
-- Median list price: $380,000
-- Median sale price: $375,000
- Total homes sold: 829
-- Share that sold above list: 58.6%
You may also like: Here are two ways to use your home's equity to increase its value
#11. Trenton, New Jersey

- Average price difference: 2.78% over asking
-- Median list price: $424,900
-- Median sale price: $450,000
- Total homes sold: 346
-- Share that sold above list: 63.9%
#10. Bridgeport, Connecticut

- Average price difference: 2.83% over asking
-- Median list price: $555,000
-- Median sale price: $700,000
- Total homes sold: 1,019
-- Share that sold above list: 57.2%
#9. Manchester, New Hampshire

- Average price difference: 2.85% over asking
-- Median list price: $474,900
-- Median sale price: $504,900
- Total homes sold: 507
-- Share that sold above list: 67.9%
#8. Oakland, California

- Average price difference: 2.91% over asking
-- Median list price: $887,000
-- Median sale price: $900,000
- Total homes sold: 1,887
-- Share that sold above list: 55.6%
#7. San Jose, California

- Average price difference: 3.64% over asking
-- Median list price: $1,450,000
-- Median sale price: $1,533,000
- Total homes sold: 1,150
-- Share that sold above list: 60.4%
You may also like: The 50 places where homes are taking the longest to sell
#6. San Francisco, California

- Average price difference: 4.22% over asking
-- Median list price: $1,398,000
-- Median sale price: $1,450,000
- Total homes sold: 813
-- Share that sold above list: 55%
#5. Hartford, Connecticut

- Average price difference: 4.84% over asking
-- Median list price: $349,900
-- Median sale price: $375,000
- Total homes sold: 1,315
-- Share that sold above list: 71%
#4. Newark, New Jersey

- Average price difference: 5.26% over asking
-- Median list price: $549,000
-- Median sale price: $620,000
- Total homes sold: 2,127
-- Share that sold above list: 68.5%
#3. Syracuse, New York

- Average price difference: 5.85% over asking
-- Median list price: $229,900
-- Median sale price: $253,470
- Total homes sold: 638
-- Share that sold above list: 63.9%
#2. Buffalo, New York

- Average price difference: 6.24% over asking
-- Median list price: $249,900
-- Median sale price: $275,000
- Total homes sold: 1,127
-- Share that sold above list: 67.8%
You may also like: 11 ways to prevent a chimney fire
#1. Rochester, New York

- Average price difference: 13.07% over asking
-- Median list price: $219,900
-- Median sale price: $259,450
- Total homes sold: 1,098
-- Share that sold above list: 78%
#25. Richmond, Virginia

- Average price difference: 0.20% over asking
-- Median list price: $387,500
-- Median sale price: $399,700
- Total homes sold: 1,310
-- Share that sold above list: 37.3%
#24. Montgomery County, Pennsylvania

- Average price difference: 0.29% over asking
-- Median list price: $465,000
-- Median sale price: $483,450
- Total homes sold: 1,723
-- Share that sold above list: 41.2%
#23. Providence, Rhode Island

- Average price difference: 0.32% over asking
-- Median list price: $475,000
-- Median sale price: $495,000
- Total homes sold: 1,200
-- Share that sold above list: 49.3%
#22. Frederick, Maryland

- Average price difference: 0.38% over asking
-- Median list price: $506,929
-- Median sale price: $570,000
- Total homes sold: 1,008
-- Share that sold above list: 41.4%
#21. Rockingham County, New Hampshire

- Average price difference: 0.60% over asking
-- Median list price: $569,900
-- Median sale price: $580,000
- Total homes sold: 447
-- Share that sold above list: 50.1%
You may also like: Using vacant commercial spaces as affordable artist studios is a win-win
#20. New Brunswick, New Jersey

- Average price difference: 0.61% over asking
-- Median list price: $524,900
-- Median sale price: $550,000
- Total homes sold: 2,219
-- Share that sold above list: 47.0%
#19. Manchester, New Hampshire

- Average price difference: 0.63% over asking
-- Median list price: $479,900
-- Median sale price: $481,000
- Total homes sold: 401
-- Share that sold above list: 50.6%
#18. Boston

- Average price difference: 0.78% over asking
-- Median list price: $699,900
-- Median sale price: $710,000
- Total homes sold: 3,051
-- Share that sold above list: 48.1%
#17. Springfield, Massachusetts

- Average price difference: 0.82% over asking
-- Median list price: $339,700
-- Median sale price: $340,000
- Total homes sold: 505
-- Share that sold above list: 49.9%
#16. Reading, Pennsylvania

- Average price difference: 0.88% over asking
-- Median list price: $269,900
-- Median sale price: $278,000
- Total homes sold: 357
-- Share that sold above list: 44.5%
You may also like: How does a reverse mortgage work in Canada?
#15. Worcester, Massachusetts

- Average price difference: 0.98% over asking
-- Median list price: $429,900
-- Median sale price: $455,000
- Total homes sold: 791
-- Share that sold above list: 52.0%
#14. Albany, New York

- Average price difference: 1.06% over asking
-- Median list price: $315,000
-- Median sale price: $320,000
- Total homes sold: 795
-- Share that sold above list: 49.2%
#13. Camden, New Jersey

- Average price difference: 1.07% over asking
-- Median list price: $350,000
-- Median sale price: $355,000
- Total homes sold: 1,074
-- Share that sold above list: 50.5%
#12. Nassau County, New York

- Average price difference: 1.15% over asking
-- Median list price: $699,990
-- Median sale price: $695,000
- Total homes sold: 1,899
-- Share that sold above list: 54.1%
#11. New Haven, Connecticut

- Average price difference: 1.49% over asking
-- Median list price: $350,000
-- Median sale price: $369,000
- Total homes sold: 745
-- Share that sold above list: 52.8%
You may also like: Reduced interest rates affect mortgage costs—here's what to know
#10. Bridgeport, Connecticut

- Average price difference: 1.71% over asking
-- Median list price: $570,000
-- Median sale price: $630,000
- Total homes sold: 755
-- Share that sold above list: 52.1%
#9. Lancaster, Pennsylvania

- Average price difference: 2.09% over asking
-- Median list price: $319,900
-- Median sale price: $333,750
- Total homes sold: 421
-- Share that sold above list: 43.5%
#8. Oakland, California

- Average price difference: 2.58% over asking
-- Median list price: $849,000
-- Median sale price: $957,000
- Total homes sold: 1,603
-- Share that sold above list: 53.6%
#7. Syracuse, New York

- Average price difference: 2.63% over asking
-- Median list price: $225,000
-- Median sale price: $241,500
- Total homes sold: 517
-- Share that sold above list: 59.6%
#6. Hartford, Connecticut

- Average price difference: 3.04% over asking
-- Median list price: $345,000
-- Median sale price: $360,000
- Total homes sold: 1,087
-- Share that sold above list: 64.5%
You may also like: The top city everyone wants to move to in every state in 2024
#5. San Jose, California

- Average price difference: 3.54% over asking
-- Median list price: $1,425,000
-- Median sale price: $1,528,500
- Total homes sold: 1,059
-- Share that sold above list: 58.6%
#4. San Francisco

- Average price difference: 3.60% over asking
-- Median list price: $1,300,000
-- Median sale price: $1,484,000
- Total homes sold: 859
-- Share that sold above list: 53.0%
#3. Newark, New Jersey

- Average price difference: 3.79% over asking
-- Median list price: $549,000
-- Median sale price: $590,061
- Total homes sold: 1,524
-- Share that sold above list: 64.8%
#2. Buffalo, New York

- Average price difference: 4.06% over asking
-- Median list price: $229,900
-- Median sale price: $251,400
- Total homes sold: 870
-- Share that sold above list: 60.8%
#1. Rochester, New York

- Average price difference: 8.70% over asking
-- Median list price: $200,000
-- Median sale price: $243,000
- Total homes sold: 930
-- Share that sold above list: 68.1%
You may also like: 10 U.S. cities that saw the biggest annual rent increases and drops over one year